In your Tableau journey, you may come across the need to filter to the latest year, month, week, or other fiscal period when your dashboard is opened by your users. This is an easy task if your business follows the standard Gregorian calendar, but if it follows a custom fiscal calendar it can be more difficult. You could use a parameter, but that disables your dashboard from being able to select multiple months or years at one time (in a non-clunky way). Thankfully, there is a neat and easy solution to this problem!
The overall gist of this trick is that you need to create a Date or Date & Time calculated field and format it where it functions like a date or date time, but appears to be a year, month, week, or other fiscal period. Let's get into the details...
Fiscal Year Filter
For the fiscal year, since many businesses do not use the Gregorian calendar or a calendar that is built into Tableau, we can use a calculated field that functions as a date. We will format that calculated field to appear to be a fiscal year. Making it function as a date allows us to use the "Filter to latest date value when workbook is opened" option in a filter. Use the COPY button to snag the calculated field below.
Fiscal Year
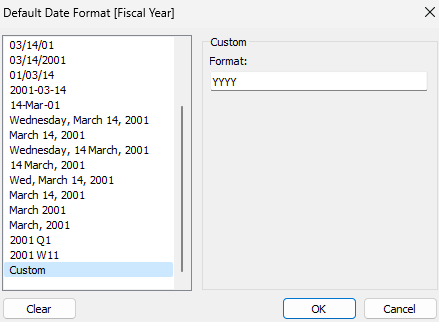
MAKEDATE([FISCAL_YEAR],1,1)Once you've created that calculated field, right click on the pill under your dimensions and select "Default Properties" and then "Date Format...". Choose "Custom" and type out the custom format "YYYY" as pictured below.
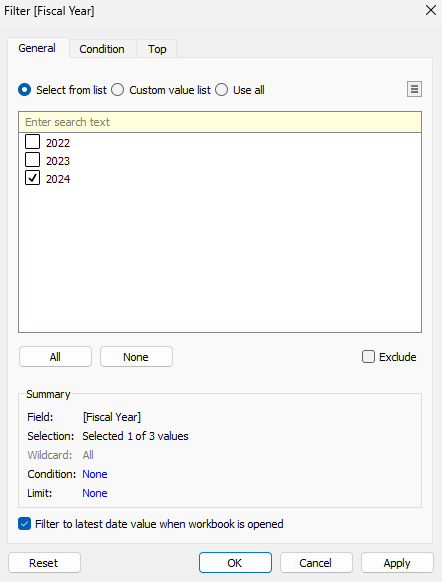
Next, drag your "Fiscal Year" calculated field to the Filter card and select "Individual Dates". Check the "Filter to latest date value when workbook is opened" option. Once you do that, your end user will experience a dashboard that is always filtered to the most recent fiscal year for eternity.
Fiscal Month Filter
For the most recent fiscal month filter approach we will simply add our fiscal month dimension to a calculated field. Grab it below...
Fiscal Month
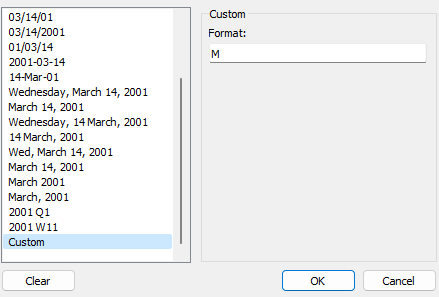
MAKEDATE([FISCAL_YEAR],[FISCAL_MONTH],1)We need to format this newly created calculated field as simply "M" for the custom format.
Then we can drag it over to the Filter card as "Months". In the filter editor, we can check the option "Filter to latest date value when workbook is opened".
This means our Tableau workbook is now able to filter to the latest month for the current fiscal year, even if there are more years with higher month numbers present in our data (ex. FY22-FM5 is more recent than FY21-FM12). If we had used just the month part of the MAKEDATE function with a static year, our calculated field would not be smart enough to know that any month in the current fiscal year is more recent than past fiscal years.
Fiscal Week Filter
The fiscal week approach is similar to the fiscal year approach except we will be using a MAKEDATETIME function and a MAKETIME function. You can use the below calculated field.
Fiscal Week
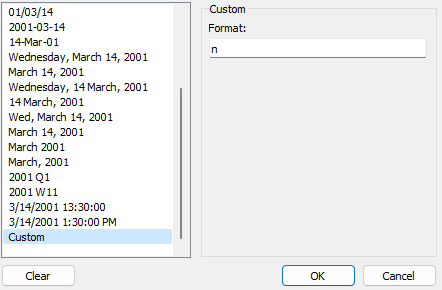
MAKEDATETIME(MAKEDATE([FISCAL_YEAR],1,1),MAKETIME(0,[FISCAL_WEEK],0))When you format the calculated field under "Default Properties", format it as simply "n" as the custom format because you only want the "minute" of the fake date time to display.
You can then drag the calculated field to the Filter card and select "Minutes". Then check the "Filter to latest date value when workbook is opened" option. Because we included the fiscal year in the above calculated field, our approach is able to show that fiscal week 3 (as an example) of the current year is a more recent "date time" than fiscal week 49 of the previous year. Isn't that cool!?
The reason we couldn't use MAKEDATE in this case is because there is no part of that function (year, month, day) that can contain 52 increments (weeks).
Fiscal Quarter and Half
For a fiscal quarter or half we can use MAKEDATE and use the day part of the function for either. Use either of the below calculated fields and format the one you use as custom format "D". Then drag your new dimension to the Filter card and select "Days". In the filter check "Filter to latest date value when workbook is opened".
Fiscal Quarter
MAKEDATE([FISCAL_YEAR],1,[FISCAL_QUARTER])Fiscal Half
MAKEDATE([FISCAL_YEAR],1,[FISCAL_HALF])Empower your Tableau development with CopyCalc - the ultimate toolkit designed to supercharge your visualization game. Find useful calculated fields, design with the custom color palette maker, and format messy calculated fields instantly with the formatter.